OVERVIEW
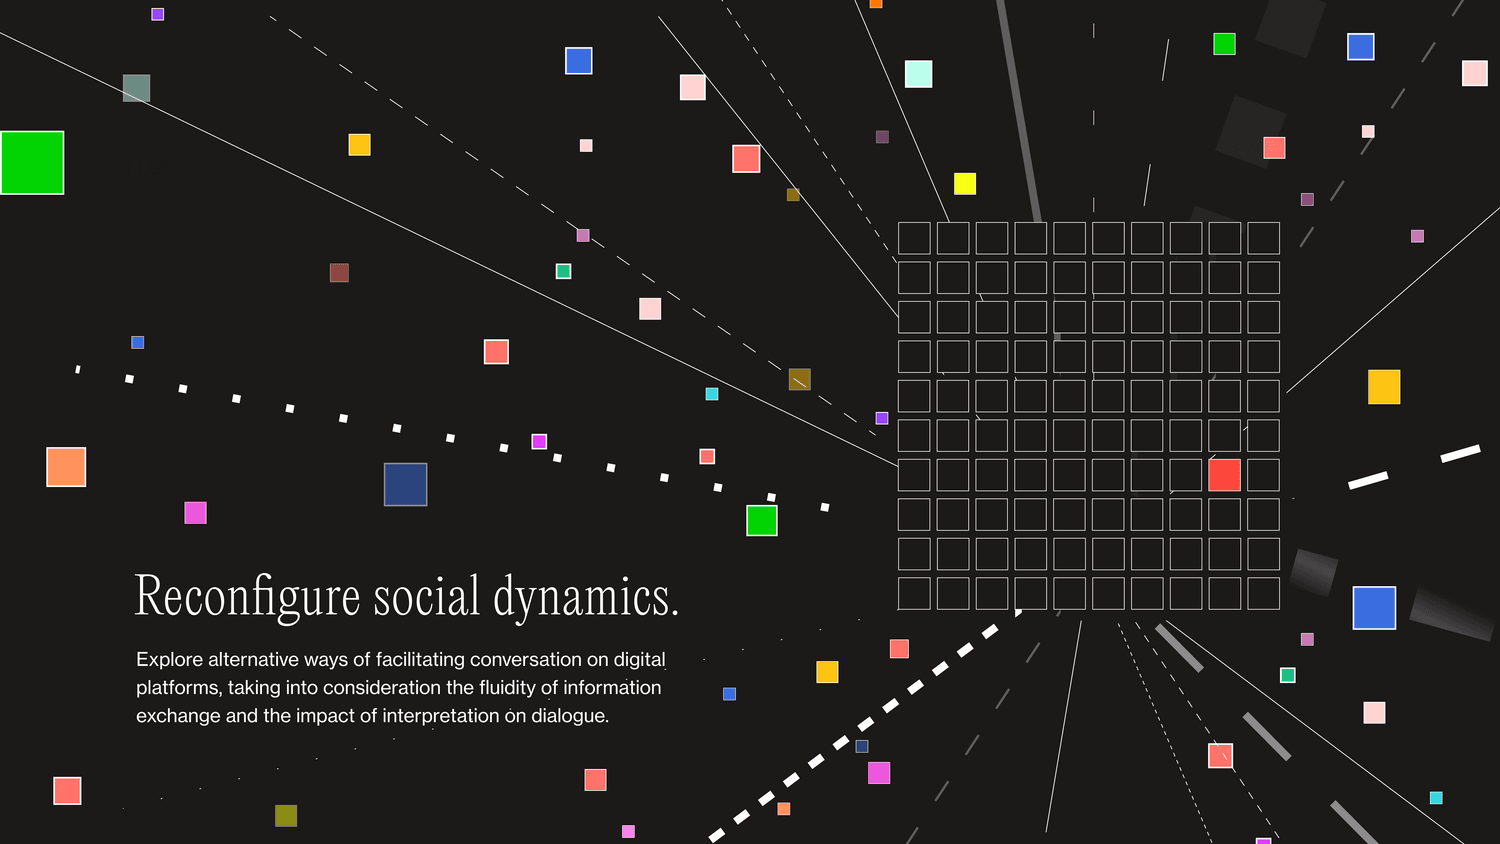
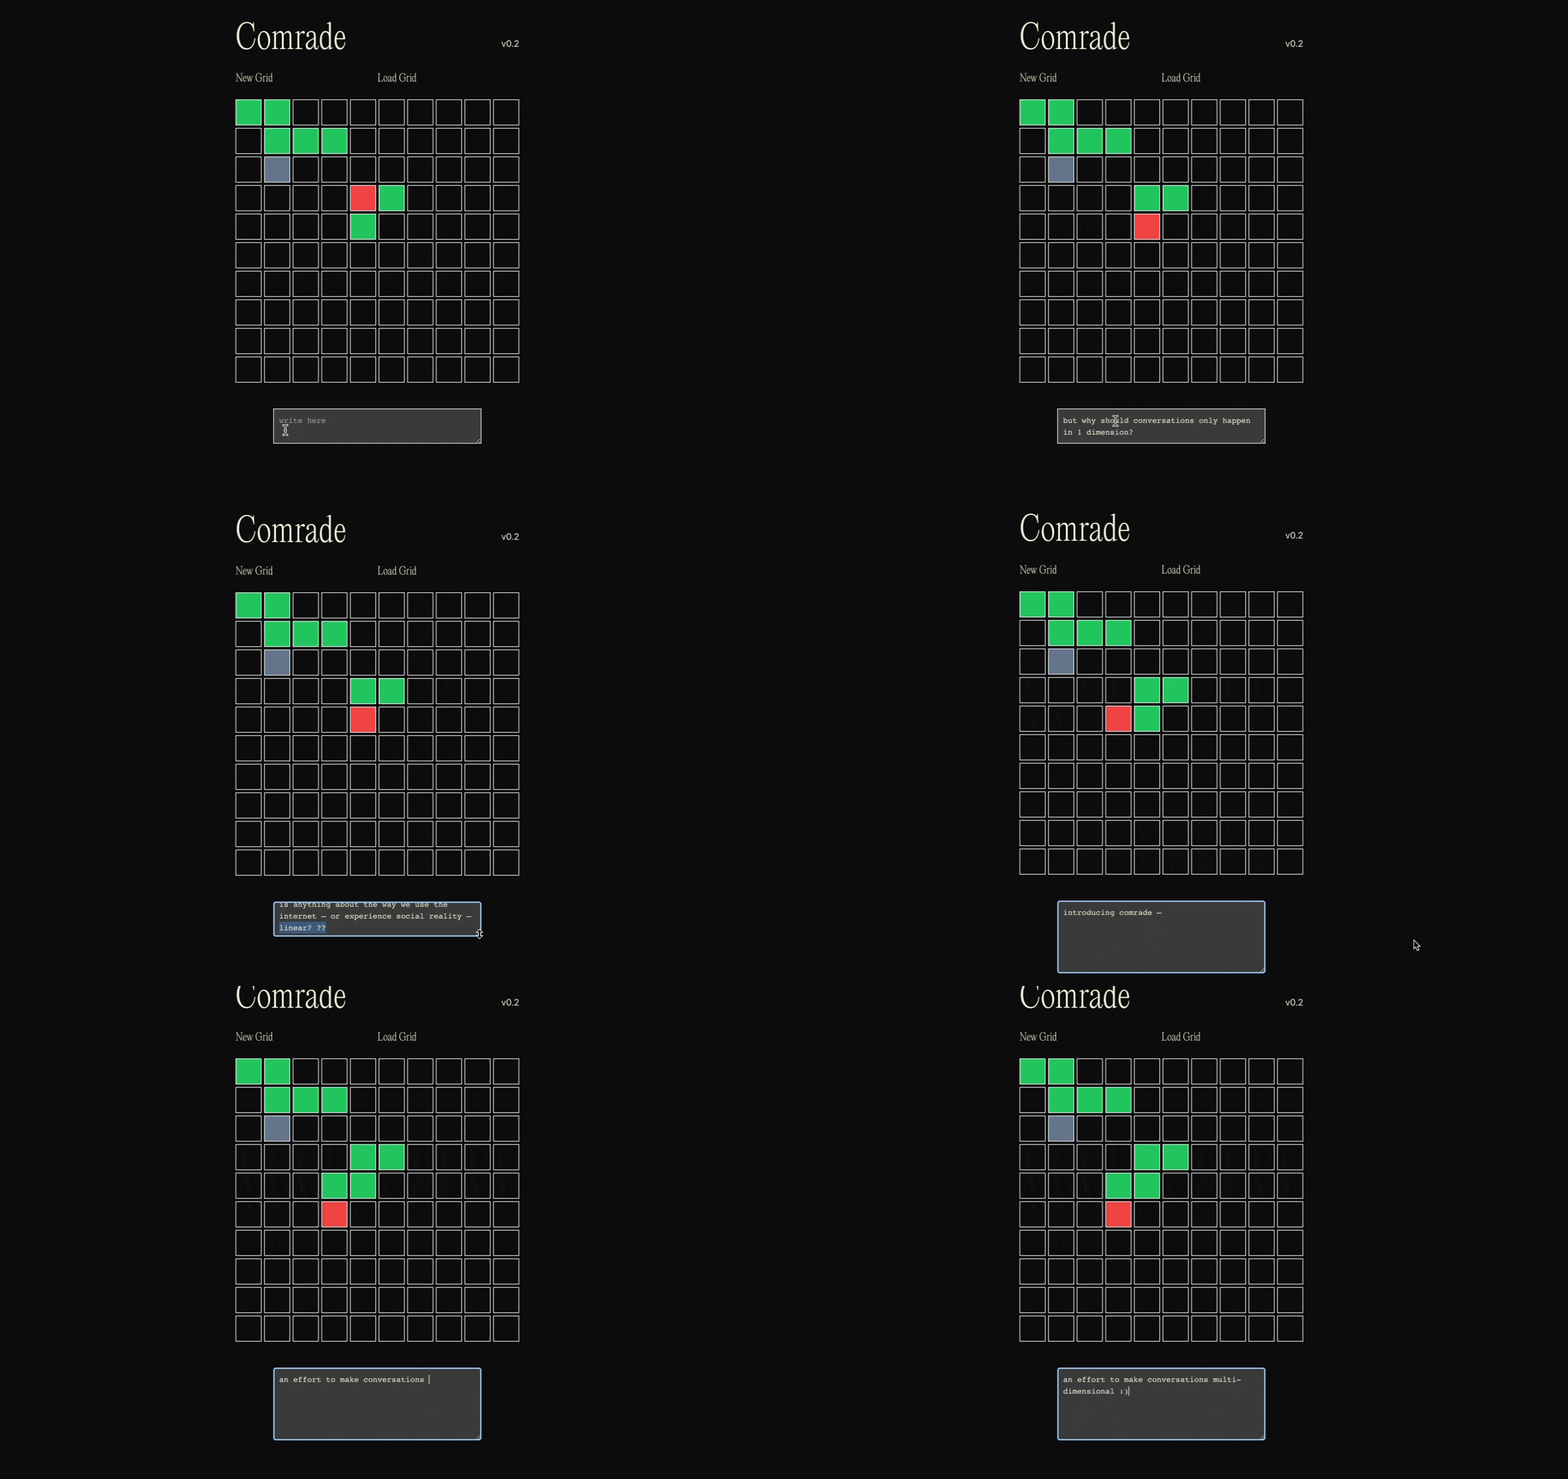
Comrade tries to offer a material way to express the topography of a conversation.
It holds information about the spatial layout of a dialogue. It attempts to be a canvas for your train of thought, providing 2D visual presence for deviations in a conversation.
SCOPE
- User Research
- Art Direction
- User Interface Design
TOOLS
- Figma
- Vue.js
- Firebase
KEY METHODOLOGY
Mixed-methods research


CONTEXT
Conversations are a factor of the language that facilitates them —
In digital conversations, there is an added medium — the visual interface. Most digital interfaces and platforms visualize ‘a stream of thought’ or conversation as a straight line.
One thought follows another — resulting in a stack that's navigated top to bottom. ‘Replies’ on messaging platforms like (iMessage, Signal, Telegram, WhatsApp, WeChat, KakaoTalk) are presented linearly.
In messaging, navigating through text is tedious — you either ‘scroll’ or search for keywords - hoping to be transported to the right spot. It is hard to get a sense of when a topic shift occurs unless you read through everything. Usually, you start from the top and keep scrolling to the bottom. It’s one-dimensional.

INSPIRATION
The performance of socialness on the internet is nuanced and pools intent from multiple directions.
This internal context shapes the conversation and its outcomes. And so, a conversation meanders — the trace of path it takes is probably different for both the people.
Maybe they thought about some other things, had thoughts that intruded but didn’t quite make their way to being expressed. How does one start a conversation? How do people respond when they start?


PROCESS
The whiteboard version explores the possibility of rearranging the squares—
Forming a matrix of content that is arranged by a logic that the participants collectively decide on by labeling direction.

BACKEND AND TOOLS
The current version is written in VSCode and powered by Vite.js, a frontend tool that sets up a development environment for frameworks like React, with a dev server by Vercel. It uses HTML, CSS, React, supported by Typescript. The CSS is generated by Tailwind classNames. Design prototypes of the project are constructed in Figma.


VERSION 1
Designing a quick prototype for testing digital affordances. Mapping user needs from research to implementation.

VERSION 2
The final version of Comrade consists of a front-end website with a realtime database that allows multiple people to use the site simultaneously.

Synthesis
In this playground, each reply exists as a distinct artifact that can be tinkered with. As thoughts occupy space and time, the grid of artifacts a becomes a structuring mechanism.
Infrastructure
You can think of it as a map — maps are semiotically useful things, especially when we start from different contexts — they behave as a framework that facilitates getting people to make bridges: and agree on goals, means, language .. in general useful for designing meaning collaboratively.

FEATURES
Malleability
You decide what rules you’re playing by; You can actively affect the social contract. Everything is transient; nothing is permanent. You can go back and change what you said; you can choose to be antagonistic and delete what everyone else said. but it comes down to whatever social agreement you have with other people.There are less constraints, so you have to have a mutual agreement to play along. That itself can be broken, too.

FEATURES
Speaking / Listening
You can’t see what someone else’s content is and enter your content at the same time, because you can only be in one square at the same time. You can either digest information and respond, or make a decision to type and ignore what else is going on. You can see what is going on, because you can see colors changing and contributions being made. You have to balance the pacing of the call and response.


Fig A. In this figure. we see two discrete blocks on the top right, and a mass of conversation that somewhat resembles a black-berry bush at the bottom. These two areas are disconnected, both in their content and arrangement — the top two squares just confirm the presence of the other person, and acknowledge the medium.
‘hello are you there?’
‘yeah i am here’
The blackberry bush is made up of teal (User 1) giving me feedback on the project, with me in peach (User 2) asking a few clarifying questions or elaborating on my intention. User 1 talks more, takes up more space, but that's par for the course for the nature of this conversation.
FEATURES
Analysis
The second factor to analyse is the temporal distance as it tracks the sequence. (timestamp). Each part shows a shift in context. Finally the conversation concludes.

Fig B.1 Key mapping of how this conversation actually unfolds.

Fig B. Here is a conversation between two people on a blind date. They are strangers. I use a prompt here to guide the conversation. Once the conversation has concluded, unless you have a recording of the conversation, it's a little hard to decode what this couldve possibly been about.

Fig C. Progression of topics within a conversation between 2 people. Here, theres multiple streams of topics to follow. In a conversation with more than 3 people, this gets further complicated — with multiple voices, and more ground to cover.
FEATURES
Memorialization
When people revisit the grid, it acts as a visual artifact that is connected to a process of having a conversation. The artifact is a gift or a reminder. The patterns give a glimpse into the nature of the conversation by visualizing the data.

